
基础函数图像的绘制

一、基础的一次、二次函数图像绘制
先来考虑最简单的情况:若有函数
考虑到
回想初中阶段第一次学习函数图像的时候,课本介绍的就是描点连线的方法,所以我们可以使用描点连线的方法来绘制函数图像,先计算每个 X 坐标对应的函数坐标值,然后描点连线,这样子可以就可以处理非线性函数了,代码如下:
#include <conio.h>
#include <graphics.h>

constexpr double k			= -2;
constexpr double b			= 40;
constexpr int	 width		= 640;
constexpr int	 height		= 480;
constexpr int	 halfWidth	= width / 2;
constexpr int	 halfHeight = height / 2;

double f(const double& x) {
	return k * x + b;
}

void drawAxis() {
	setlinecolor(RED);
	line(-halfWidth, 0, halfWidth, 0);
	line(0, -halfHeight, 0, halfHeight);
}

int main() {
	initgraph(width, height);

	// 设置中心点,相当于确定直角坐标系 XoY 的原点
	setorigin(halfWidth, halfHeight);
	// 绘制坐标轴
	drawAxis();

	setlinecolor(YELLOW);

	for (int pixel = -halfWidth; pixel < halfWidth; ++pixel) {
		// 计算当前点和下一个点
		int localValue = static_cast<int>(f(pixel));
		int nextValue  = static_cast<int>(f(pixel + 1));

		// 描点连线
		putpixel(pixel, localValue, YELLOW);
		putpixel(pixel + 1, nextValue, YELLOW);
		line(pixel, localValue, pixel, nextValue);
	}

	_getch();

	return 0;
}
运行代码后,会有如下效果:
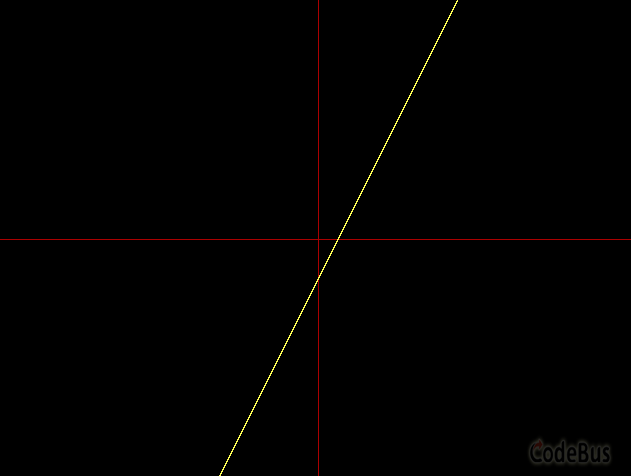
不过,可能已经有读者发现了,绘制出来的函数图像其实并不正确,这是因为在执行 setorigin 以后,建立的平面直角坐标系 XOY 与我们平时常用的坐标系的 Y 轴是相反的,所以在函数 f 中,应该修改函数的返回值为负数,就像这样:
double f(const double& x) {
	return -(k * pow(x, 2) + b);
}
这个方法不仅能够画出一次函数的图像,还能够画出二次函数的图像:

目前看来,这个方法似乎能很好地绘制出函数的图像,然而存在两个问题:
- 绘制出的函数图像不能够调整缩放比例。
- 这个方法不能处理函数图像上的断点和某些趋于无穷的函数图像。
第一个问题非常好解决,只需要加入一个 step 变量代表计算机上每一个像素对应的步长,和一个 scale 代表 y 轴的缩放参数,代码如下:
#include <conio.h>
#include <graphics.h>

constexpr double k			= 0.01;
constexpr double b			= -40;
constexpr int	 width		= 640;
constexpr int	 height		= 480;
constexpr int	 halfWidth	= width / 2;
constexpr int	 halfHeight = height / 2;

double f(const double& x) {
	return -(k * x * x + b);
}

void drawAxis() {
	setlinecolor(RED);
	line(-halfWidth, 0, halfWidth, 0);
	line(0, -halfHeight, 0, halfHeight);
}

int main() {
	initgraph(width, height);

	// 步长
	constexpr double step	 = 0.6;
	// y 轴缩放系数
	constexpr double scale	 = 1.7;
	double			 stepNow = -halfWidth * step;

	// 设置中心点,相当于确定直角坐标系 XoY 的原点
	setorigin(halfWidth, halfHeight);
	// 绘制坐标轴
	drawAxis();

	setlinecolor(YELLOW);

	for (int pixel = -halfWidth; pixel < halfWidth; ++pixel) {
		// 计算当前点和下一个点
		int localValue = static_cast<int>(f(stepNow));
		int nextValue  = static_cast<int>(f(stepNow + step));

		// 描点连线
		putpixel(pixel, scale * localValue, YELLOW);
		putpixel(pixel + 1, scale * nextValue, YELLOW);
		line(pixel, scale * localValue, pixel, scale * nextValue);

		stepNow += step;
	}

	_getch();

	return 0;
}
然而第二个问题就比较棘手了,为了更加方便读者理解,这里我放出使用这个方法绘制的两个函数的图像:


其中图一是
导致没有正常绘制出曲线的原因是在原本的代码中,计算函数值的时候就将函数的值转换成了 int 类型,丢失了浮点数的小数位,就像这样:
int localValue = static_cast<int>(f(stepNow));
int nextValue  = static_cast<int>(f(stepNow + step));
其实这个问题非常好解决,只需要把代码改成这样:
// 计算当前点和下一个点
double localValue = f(stepNow);
double nextValue  = f(stepNow + step);

// 描点连线
putpixel(pixel, int(scale * localValue), YELLOW);
putpixel(pixel + 1, int(scale * nextValue), YELLOW);
line(pixel, int(scale * localValue), pixel, int(scale * nextValue));
就可以正常绘制出来了,但是多画出来的渐近线问题始终没有被解决。
二、解决断点问题
解决断点问题,有很多种方法,数学上断点的定义是
第一种就是设定一个阈值
实际上,观察后发现,仅从图像上而言,两个像素之间的图像看起来不是严格递增,就是严格递减的,这是因为最终要干的事情就是在两点之间连线,换而言之,哪怕这个函数实际上在
若函数
#include <cmath>
#include <conio.h>
#include <graphics.h>

constexpr int width		 = 640;
constexpr int height	 = 480;
constexpr int halfWidth	 = width / 2;
constexpr int halfHeight = height / 2;

void drawAxis() {
	setlinecolor(RED);
	line(-halfWidth, 0, halfWidth, 0);
	line(0, -halfHeight, 0, halfHeight);
}

double f(const double &x) {
	return -(sin(x) * tan(x));
}

int main() {
	constexpr double step	 = 0.06;
	constexpr double scale	 = 17;
	double			 x0		 = -halfWidth * step;

	initgraph(width, height);
	setorigin(halfWidth, halfHeight);

	BeginBatchDraw();

	// 绘制坐标轴
	drawAxis();

	setlinecolor(YELLOW);
	for (int pixel = -halfWidth; pixel < halfWidth; ++pixel) {
		double result = f(x0);
		double next	  = f(x0 + step);

		// 计算 f(x0 + ω)
		double omega  = f(x0 + step / 100);

		// 对比 f(x0) 与 f(x1) 然后利用 f(x0 + ω) 与 f(x1) 判断是否是断点
		if (next > result) {
			if (omega > result) {
				putpixel(pixel, (int)(result * scale), YELLOW);
				putpixel(pixel + 1, (int)(next * scale), YELLOW);
				line(pixel, (int)(result * scale), pixel + 1, (int)(next * scale));
			} else {
				putpixel(pixel, (int)(result * scale), YELLOW);
				putpixel(pixel + 1, (int)(next * scale), YELLOW);
			}
		} else {
			if (omega < result) {
				putpixel(pixel, (int)(result * scale), YELLOW);
				putpixel(pixel + 1, (int)(next * scale), YELLOW);
				line(pixel, (int)(result * scale), pixel + 1, (int)(next * scale));
			} else {
				putpixel(pixel, (int)(result * scale), YELLOW);
				putpixel(pixel + 1, (int)(next * scale), YELLOW);
			}
		}

		x0 += step;
	}

	FlushBatchDraw();

	_getch();

	return 0;
}
这个时候再去绘制


然而,这种方法并不能够正确绘制

上面的问题可以通过引入大整数运算以及其他的优化方法来解决,但依然存在一个问题:我们并没有考虑函数的定义域问题,实际上并不是所有函数都在区间内有定义,例如,若要绘制
三、总结
本文介绍了一个方法,这个方法能够绘制一些基本的函数图像,然而,文中只是对绘制函数图像这个问题进行了非常浅显的讨论,这个方法也之能绘制出一些非常有限的函数图像。
事实上,要想在计算机中绘制出函数图像,并非一件易事,若有想要深入了解的同学,可以查阅这篇 Jeff Tupper 于发表 2001 年的一篇论文,文中介绍的算法能够绘制出许多非常刁钻的函数图形,甚至是塔伯自指涉公式。
添加评论
取消回复