
【EasyGPU】Lesson 2:渲染我们的第一张图片——绑定纹理与 Profiler API

第二节:渲染我们的第一张图片:绑定纹理与 Profiler API
前言:在本章节中,我们将正式开始渲染我们的第一张图片并将它绘制到 EasyX 窗口上。我们依然会通过一个简单的例子来向你介绍 EasyGPU 中的 Texture2D 类和 EasyGPU 中基本的调试方法。
GPU 向量的分量访问与 Swizzle
在上一节中,我们介绍了 Float2、Float3、Float4 等 GPU 向量类型。本节在使用它们处理图像像素之前,我们需要先了解如何在 Kernel 中访问这些向量的各个分量。
分量访问:使用 .x() .y() .z() .w()
与 C++ 中常见的结构体成员访问不同,EasyGPU 中的 GPU 向量类型使用函数调用语法来访问分量:
Float3 color = MakeFloat3(1.0f, 0.5f, 0.0f);
Float r = color.x();  // 获取 x 分量,值为 1.0
Float g = color.y();  // 获取 y 分量,值为 0.5
Float b = color.z(); // 获取 z 分量,值为 0.0注意:必须使用 x()、y()、z()、w() 这样的函数调用语法,而不是 .x、.y、.z。后者在编译期无法通过。
Swizzle 访问:提取子向量
EasyGPU 支持 GLSL 风格的 swizzle 操作,可以方便地重新排列或提取向量的分量:
Float4 rgba = MakeFloat4(1.0f, 0.5f, 0.0f, 1.0f);

// 提取前三个分量
Float3 rgb = rgba.xyz();  // 得到 (1.0, 0.5, 0.0)

// 提取前两个分量
Float2 rg = rgba.xy();    // 得到 (1.0, 0.5)

// 重新排列分量(交换 R 和 B)
Float3 bgr = rgba.zyx();  // 得到 (0.0, 0.5, 1.0)

// 只提取指定分量
Float2 gb = rgba.yz();    // 得到 (0.5, 0.0)
常见的 swizzle 组合包括:
| Swizzle | 适用于 | 结果类型 | 说明 |
| .x() .y() .z() .w() | Float2/3/4 | Float | 获取单个分量 |
| .xy() | Float2/3/4 | Float2 | 提取前两个分量 |
| .xyz() | Float3/4 | Float3 | 提取前三个分量 |
| .xyzw() | Float4 | Float4 | 提取所有分量(相当于复制) |
重要提示: Swizzle 访问同样返回 GPU 表达式类型,只能在 Kernel 内部使用,不能用于 CPU 端的常规 C++ 代码。
理解了这些向量操作后,我们就可以开始处理图像像素了。接下来看本节的示例代码:
#include <GPU.h>
#include <graphics.h>

#pragma comment(lib, "opengl32.lib")

int main() {
    initgraph(640, 480);

    Texture2D<PixelFormat::RGBA8> texture(getwidth(), getheight(), GetImageBuffer());
    try {
        Kernel2D kernel([&](Int& X, Int& Y) {
            auto tex = texture.Bind();
            auto r = ToFloat(X) / getwidth();
            auto g = ToFloat(Y) / getwidth();
            auto b = (r + g) / 2;

            tex.Write(X, Y, MakeFloat4(b, g, r, 1));
        });
        kernel.Dispatch(getwidth() / 16, getheight() / 16, true);
        texture.Download(GetImageBuffer());

        while (true) {
            Sleep(1);
        }
    }
    catch (ShaderCompileException& e) {
        MessageBoxA(nullptr, e.what(), "Shader Compile Error", MB_OK | MB_ICONERROR);
        std::cout << e.GetBeautifulOutput() << std::endl;
    }

    return 0;
}
编译运行它,我们就得到了我们在 EasyX 世界中的第一个 GPU 渲染图像:
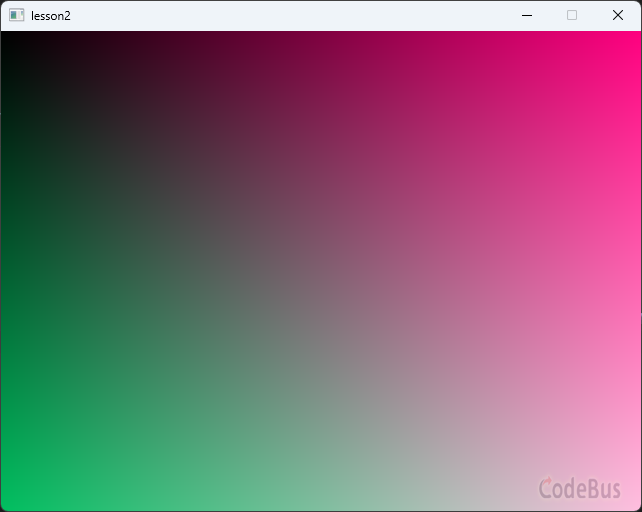
接下来我们由这个例子为引来分析这里面涉及到的 EasyGPU 概念。
EasyGPU 中的异常处理
在 EasyGPU 中会抛出一种异常 ShaderCompileException。该异常通常出现在 Kernel 构建过程中,如果一个 Kernel 转化对应的着色器代码无法通过图形 API 的编译,则该异常会被抛出。在你的 C++ 代码可以通过编译的情况下,该异常一般不会触发,然而,鉴于可能存在的少数意外情况。为了稳健性,我们依然建议你在项目中处理这个异常。
纹理——在 CPU-GPU 间传输图像的方案
在示例代码中我们使用了 Texture2D<PixelFormat> 来在 CPU-GPU 之间传输图像。Texture2D 是一个模板类,其模板类型接受一个 PixelFormat 的输入,PixelFormat 是为了兼容多种像素格式所设置的 API,在 EasyGPU 中,有如下几种像素格式受到支持:
R8,RG8,RGBA8,R32F,RG32F,RGBA32F,R16F,RG16F,RGBA16F,R32I,RG32I,RGBA32I,R32UI,RG32UI,RGBA32UI
而在 EasyX 中,所有你创建的图像的像素格式本质上其实是 BGRA8(蓝-绿-红-透明),虽然这并不在 EasyGPU 的直接支持范围内,但是我们可以使用 RGBA8 来代替 BGRA8,只需要在我们的 Kernel 中交换最终输出的 R 和 B 分量即可。
Texture2D<PixelFormat> 支持两种构建模式:一是从已有的 CPU Buffer 复制上传至 GPU,这样我们可以把 EasyX 中所有的绘图对象都通过纹理上传;二是在 GPU 处创建一个指定大小的空 Buffer:
Texture2D<PixelFormat::RGBA8> texture(getwidth(), getheight(), GetImageBuffer()); // 指定长宽并且传入 CPU 的 Buffer
Texture2D<PixelFormat::RGBA8> texture(getwidth(), getheight()); // 指定长宽创建一个空的 Buffer
和我们在 Lesson1 中讲到 Buffer<T> 一样,Texture2D<PixelFormat> 同样需要在 Kernel 中使用 Bind 函数绑定该纹理至 Kernel 中,并获得一个纹理的引用对象 TextureRef<PixelFormat>。
TextureRef<PixelFormat> 有几个需要关注的成员函数:
- GetWidth() 和 GetHeight() 分别返回该纹理的宽高,返回值类型是 uint32_t。
- Read(X, Y) 函数可以读取纹理指定位置的颜色,值得注意的是 X、Y 不可超出纹理大小范围,如:
auto col = tex.Read(X, Y);3. Write(X, Y, Color) 函数可以将指定的颜色写入纹理,如:
tex.Write(X, Y, MakeFloat4(b, g, r, 1.0));同 Buffer<T> 一样 Texture2D<PixelFormat> 同样支持将纹理缓存通过 Download 方式下载到 CPU 的 Buffer 中,如示例代码中:
texture.Download(GetImageBuffer());将渲染结果纹理传回屏幕 Buffer。
同样也支持通过 Upload() 传输数据至 GPU。然而无论是 Upload 还是 Download,都要确定指定的 Buffer 内存的像素格式、大小是与 Texture<PixelFormat> 一致的。
与 Buffer<T> 不同的是,Texture2D<PixelFormat> 支持在 CPU 端动态部分更新纹理,通过 UploadSubRegion 成员函数实现:
texture.UploadSubRegion(X, Y, RegWidth, RegHeight, Buffer);这样可以将部分 Buffer 上传至纹理。
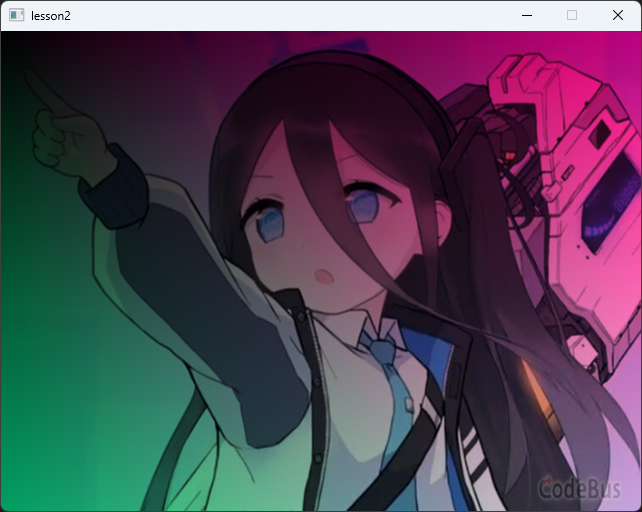
我们不仅可以利用 Texture2D<PixelFormat> 处理屏幕的 Buffer,同样也可以处理加载的 IMAGE 对象,例如:
IMAGE image;
loadimage(&image, TEXT("./test.png"));

Texture2D<PixelFormat::RGBA8> imageTexture(getwidth(), getheight(), GetImageBuffer(&image));

Kernel2D imageKernel([&](Int& X, Int& Y) {
    auto tex = imageTexture.Bind();
    Float r = ToFloat(X) / getwidth();
    Float g = ToFloat(Y) / getwidth();
    Float b = (r + g) / 2;

    tex.Write(X, Y, tex.Read(X, Y) * MakeFloat4(b, g, r, 1.0));
});

imageKernel.Dispatch(image.getwidth() / 16, image.getheight() / 16, true);

imageTexture.Download(GetImageBuffer(&image));

putimage(0, 0, &image);
得到结果如下:
最后,EasyGPU 中也提供 Texture3D<PixelFormat> 类,其用法与 Texture2D<PixelFormat> 相同,只是维度高了一维,此处不再赘述。
使用 Kernel Profiler 评估 GPU 程序性能
在 C++ 中,我们自然可以使用系统自带的 API 如 std::chrono 或者是 clock() 来计时。然而,对于我们的 GPU 程序,则很难做到这点。首先是直接使用 CPU 时间计时很有可能会有较大误差,除了统计了 GPU 代码的执行时间,还可能会有总线通讯时间等消耗。而且,一旦 kernel 数量变多,那么一个一个都用时间库统计就会变得非常麻烦。为此,EasyGPU 提供了 Profiler API 用于评估 GPU 程序性能。Profiler API 可以统计每个 Kernel 的执行时间,以刚刚的示例代码为例,我们使用加入以下代码:
Kernel::EnableKernelProfiler(true); // 启用 profiler
kernel.Dispatch(getwidth() / 16, getheight() / 16, true);
Kernel::PrintKernelProfilerInfo(); // 打印 profile 信息
于是我们可以在控制台中看到输出的 profile 信息:
║ Kernel                   │  Count │   Min(ms) │   Avg(ms) │   Max(ms) │  Total(ms) │      %  ║
║ Kernel2D                 │      1 │    10.716 │    10.716 │    10.716 │     10.716 │ 100.0%  ║
其中的 Count 是 Kernel2D 被执行的次数,Min、Avg、Max、Total 分别是最小、平均、最大、总执行时间,最后的 % 表示该 Kernel 占用的总 GPU 资源。如果只有一个 Kernel,那自然就是 100%。
在实践中,我们经常需要对某个算法多次执行,获得它的平均执行时长来评估性能,于是我们可以反复运行一个 kernel,并且利用 profiler 得到结果:
Kernel::EnableKernelProfiler(true);
for (int i = 0; i < 100; ++i) {
    kernel.Dispatch(getwidth() / 16, getheight() / 16, true);
}
Kernel::PrintKernelProfilerInfo();
得到 profile:
║ Kernel                   │  Count │   Min(ms) │   Avg(ms) │   Max(ms) │  Total(ms) │      %  ║
║ Kernel2D                 │    100 │     0.108 │     0.552 │     6.978 │     55.181 │ 100.0%  ║
一旦我们的 Kernel 变多,那么多个 Kernel2D 就会混杂在一起难以区分。因此,我们允许你给自己的 Kernel 命名——在创建 Kernel 时,在构造函数的第一个形参传入一个字符串如:
Kernel2D kernel("Rendering Screen", [&](Int& X, Int& Y) {
    auto tex = texture.Bind();
    Float r = ToFloat(X) / getwidth();
    Float g = ToFloat(Y) / getwidth();
    Float b = (r + g) / 2;

    tex.Write(X, Y, MakeFloat4(b, g, r, 1.0));
});
运行 profiler 后就可以得到一个具名的 profile 信息:
║ Kernel                   │  Count │   Min(ms) │   Avg(ms) │   Max(ms) │  Total(ms) │      %  ║
║ Rendering Screen         │    100 │     0.189 │     0.520 │     9.260 │     51.957 │ 100.0%  ║
于是,不同命名的 Kernel 就可以被区分开来统计:
║ Kernel                   │  Count │   Min(ms) │   Avg(ms) │   Max(ms) │  Total(ms) │      %  ║
║ Rendering Screen 2       │    100 │     0.282 │     0.503 │     1.471 │     50.347 │  50.9%  ║
║ Rendering Screen 1       │    100 │     0.177 │     0.486 │     6.446 │     48.644 │  49.1%  ║
Kernel::PrintKernelProfilerInfo 有两个模式,刚刚我们使用的称之为 count 模式(默认模式),count 模式会将所有数据汇总统计。除此以外还有 trace 模式,通过:
Kernel::PrintKernelProfilerInfo("trace");可以调用,trace 模式会逐个记录每次 Kernel 的用时以及对应的 Kernel 信息如下:
║ Kernel                       │   Time(ms) │     Groups │        Timestamp   ║
║ Grayscale Conversion         │      8.718 │      40x40 │         19:46:16   ║
║ Grayscale Conversion         │      0.462 │      40x40 │         19:46:16   ║
║ Grayscale Conversion         │      1.183 │      40x40 │         19:46:16   ║
║ Grayscale Conversion         │      0.476 │      40x40 │         19:46:16   ║
║ Grayscale Conversion         │      0.566 │      40x40 │         19:46:16   ║
║ Grayscale Conversion         │      0.996 │      40x40 │         19:46:16   ║
║ Grayscale Conversion         │      0.478 │      40x40 │         19:46:16   ║
║ Grayscale Conversion         │      0.584 │      40x40 │         19:46:16   ║
║ Grayscale Conversion         │      0.936 │      40x40 │         19:46:16   ║
║ Grayscale Conversion         │      0.514 │      40x40 │         19:46:16   ║
除此以外,我们还可以使用 Kernel::QueryKernelProfilerInfo 来获取指定命名 Kernel 的 Profile 信息
auto info = Kernel::QueryKernelProfilerInfo("Rendering Screen");
info.avgTimeMs; // Avg(ms)
info.totalTimeMs; // Total(ms)
info.maxTimeMs; // Max(ms)
info.minTimeMs; // Min(ms)
info.counter; // Count
info.kernelName; // Kernel 名
使用 Kernel::ClearKernelProfilerInfo 来清空所有 profile 信息:
Kernel::ClearKernelProfilerInfo();提示:Profiler 功能开启将会影响性能,建议只在 debug 模式下启用。
课后作业
作业题目
- 试阐述 Texture2D 的基本使用方法,包括:
- 如何创建 Texture2D(至少说出两种方式)
- PixelFormat 的作用是什么?为什么 EasyX 的图像可以使用 RGBA8 来兼容?
- 如何在 Kernel 中读取和写入纹理?
- Upload、Download 和 UploadSubRegion 分别有什么作用?
2. 使用 Texture2D 和 Kernel2D 实现一个简单的图像处理程序——将一张固定大小(640x640)的彩色图片转换为灰度图。
要求:
- 加载一张图片(可使用 loadimage)
- 使用 Kernel2D 遍历每个像素,将 RGB 转换为灰度值(公式:
) - 使用 Kernel::EnableKernelProfiler 的 count 模式统计性能,执行至少 100 次并打印平均耗时
- 将结果输出到屏幕上
(可选)3. 使用 CPU 也同样实现一个和 2 一样的图像处理程序,在同样的条件下比较 CPU 和 GPU 执行的速度差别。
答案
1. 略
2.
#include <GPU.h>
#include <graphics.h>
#include <iostream>

#pragma comment(lib, "opengl32.lib")

int main() {
    initgraph(640, 480);

    // 加载图片
    IMAGE image;
    loadimage(&image, TEXT("./test.png"));
    int width = image.getwidth();
    int height = image.getheight();

    // 创建纹理,绑定到图片的缓冲区
    Texture2D<PixelFormat::RGBA8> texture(width, height, GetImageBuffer(&image));

    try {
        // 创建灰度转换 Kernel
        Kernel2D grayKernel("Grayscale Conversion", [&](Int& X, Int& Y) {
            auto tex = texture.Bind();

            // 读取原始颜色
            Float4 color = tex.Read(X, Y);
            Float r = color.x();  // R 分量
            Float g = color.y();  // G 分量
            Float b = color.z();  // B 分量

            // 计算灰度值:gray = 0.299 * R + 0.587 * G + 0.114 * B
            Float gray = MakeFloat(0.299f) * r + MakeFloat(0.587f) * g + MakeFloat(0.114f) * b;

            // 输出灰度图(RGB 三个通道都等于 gray)
            // 注意:为了兼容 EasyX 的 BGRA 格式,我们交换 R 和 B 的位置
            tex.Write(X, Y, MakeFloat4(gray, gray, gray, color.w()));
        });

        // 启用性能分析
        Kernel::EnableKernelProfiler(true);

        // 执行 100 次以获取平均性能数据
        for (int i = 0; i < 100; ++i) {
            grayKernel.Dispatch((width + 15) / 16, (height + 15) / 16, true);
        }

        // 打印性能分析结果
        Kernel::PrintKernelProfilerInfo();

        // 将结果下载回图片缓冲区
        texture.Download(GetImageBuffer(&image));

        // 显示结果
        putimage(0, 0, &image);

        // 等待用户按键
        system("pause");
    }
    catch (ShaderCompileException& e) {
        MessageBoxA(nullptr, e.what(), "Shader Compile Error", MB_OK | MB_ICONERROR);
        std::cout << e.GetBeautifulOutput() << std::endl;
    }

    closegraph();
    return 0;
}
程序说明:
1. 灰度转换公式:使用标准的灰度转换权重
2. 命名 Kernel:通过给 Kernel 命名 "Grayscale Conversion",在 Profiler 输出中可以更清晰地识别
3. 异常处理:使用 try-catch 捕获 ShaderCompileException,便于调试着色器编译错误
预期的 Profiler 输出示例:
║ Kernel                   │  Count │   Min(ms) │   Avg(ms) │   Max(ms) │  Total(ms) │      %  ║
║ Grayscale Conversion     │    100 │     0.292 │     1.019 │    36.882 │    101.897 │ 100.0%  ║
3. 略
添加评论
取消回复